Introduction
AstroExcel is borne from a life long love of Astronomy, Computing and Maths. My aim has been to provide astronomy related calculations in Excel using custom functions, so if you know how to use Excel then you should be able to use AstroExcel. AstroExcel won’t work using open office or other Excel compatible spreadsheet programs because to keep the usage simple I have created over 100 new functions in Excel based around my hobby of astronomy. The advantage of this approach is no knowledge of how these functions work is needed to use them, but a basic understanding of astronomy and Excel will help.
The algorithms behind the functions are well published, in many cases I have simply taken the algorithm and converted it into an excel function. In others I have taken public domain code and converted to VBE, because this is a project that started over 10 years ago some of the original sources are lost, but where possible I attribute the original source in the code, my main sources of inspiration have come from…
- Astronomical Algorithms by Jean Meeus
- Astronomical Formulae for calculators by Jean Meeus
- Practical Astronomy with your calculator by Peter Duffett-Smith
- British Astronomical Association Journal and members handbook
- Magazines and on-line articles.
So what can you do with AstroExcel?
As with most things, what you can do is down to your imagination below are some examples of how I have used AstroExcel to enhance my knowledge of astronomy.
Plotting a partial solar eclipse
Using AstroExcel functions to calculate the position and size of the Sun and Moon and Excel’s bubble chart you can quickly plot what a solar eclipse will look like from your location, add a few spin buttons and you can control the time dynamically.

Visual representation of the altitude of the Sun and Moon
Using the same AstroExcel functions as above with the addition of altitude conversion for your location you can view the rise and set of the Sun and Moon over the day.

Equation of Time
Using the just a few AstroExcel functions you can create a chart of the equation of time for your location, handy if you make sundials.

Calculating the position of the planets
If your interest is in the solar system, then AstroExcel has a suite of functions to calculate the positions of the planets and Moon including calculating their apparent sizes and magnitudes. You can calculate the altitude of each planet for any hour of the day to produce a rise/set chart or perhaps simply plotting the positions of Jupiter’s main satellites, there are plenty of functions for these all you need to know is how to ask for example ‘what is the position of Jupiter‘ no knowledge of complicated celestial mechanics is needed to indulge your interest in astronomy.

Equipment Calculations
If your interest is more technical, then perhaps you need to calculate how focal ratio affects exit pupil size for different eyepieces or how large the zone of critical focus is for your Halpha telescope or how many pixels of star trails you will have for a given lens pointing in a given direction for a given exposure, AstroExcel includes lots of calculations for categorising your equipment or for making decisions on the right set-up for a particular project.

Year Planner
Perhaps you want to create a year planner for your astronomical society, you’ll want to show key astronomical events such as lunar phase, apogee and perigee, solar eclipses, society events, sun rise and set, oppositions of the planets, major meteor showers etc. You don’t want to be looking these up manually every year to enter into your year planner simply use AstroExcel to calculate these for the year and then automatically reformat the chart.

Radio Astronomy Antenna calculations
AstroExcel is not just for visual astronomy, because it has been guided by my interests there are functions to calculate basic Yagi designs for meteor detection

Object visibility
If you know the RA and Dec of an object you can find its altitude at various times, if you also know when the Sun rises and sets then you can overlay onto this the hours of darkness, providing a visual view of the object visibility – I guess you could add moon age and altitude to get a real sense for if the object is visible or not but I didn’t need to go that far – do this for a whole catalogue and you will have a planner for a mammoth observing session or a Messier marathon! Here is an example of how AstroExcel can really excel at producing calculations that would take forever in a planetarium program, and provide views onto the data that would otherwise be missed. I have included the Messier catalogue in AstroExcel for reference.

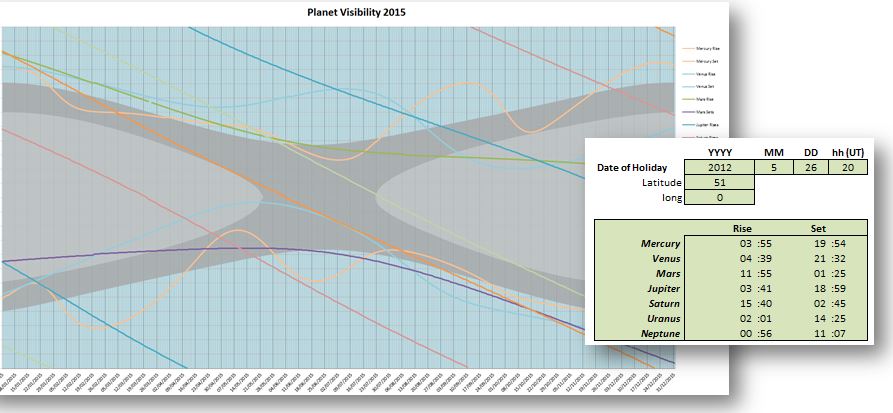
Annual Chart of planet visibility
Armed with the functions in AstroExcel you can really go to town, calculate the time of twilight and each of the planets rise and set times to produce the classic annual planet visibility info-graphic that you would normally only see in Sky and Telescope or the BAA annual handbook, these charts are dependent on your latitude the difference with this one is it is calculated for your exact location. It would be just as easy to create something similar overlaying moon phase and rise set times. But it doesn’t have to be that fancy, if all you want is a simple table of rise and set time this is very easy to achieve using the built in functions in AstroExcel.
Detector field of view
Choosing the correct combination of detector and telescope is important, with AstroExcel you can calculate the field of view the detector/telescope combination to help inform your choice, because it is ‘just a spreadsheet’ you can try out various combinations of detector and telescope until you get the combination that suits your application. AstroExcel has functions for detector field of view, detector resolution, minimum focal length for a detector to work optimally, the size of coma at the corners of the field, the % of the detector that is fully illuminated etc.

And then some…
The functions in AstroExcel allow you to create the calculations you need for your project, the examples above are included in the spreadsheet to get you going, but how you use AstroExcel will come down to your interests, I’ve heard of people using it to correlate shark attacks with Lunar visibility, plan a cubs evening observing, help with astrology – well you get all sorts – etc. AstroExcel is not a prebuilt spreadsheet – although it does come with lots of examples – it is a framework of over 100 astronomy related functions that you use in the same way you would use ‘sum’ or ‘average’ in Excel to produce all the above and more…
What’s stopping you. 🙂

Thanks a lot. its an excellent application. but Moon rise and set times in e.g. Draconids 2011 are not correct. could you please help
LikeLike
Thanks for the comment, I have now added a new function MoonRise() this will calculate the Rise, transit or Set of the Moon, I’ve tested against calsky.com and accuracy is within 1 minute.
Note: the time returned is decimal fraction of a day (change cell format to Time) all times are UT so you have to convert to your time zone and DST.
SimonTelescopium
LikeLiked by 1 person
thanks a lot. Great Job. 👍👍👍
LikeLike
Very big grat work ! compliment .
LikeLike
Fabulous ! A big thank you for these functions that I will try to use to help me identify time periods favorable for astronomical photograph.
LikeLike
Can condivide with you a my work .
http://scambiolink.superweb.ws/foglioexcelastronomia.html
download http://scambiolink.superweb.ws/acceptNOTE.php
LikeLike
An extraordinary effort BUT….I am not certain of the accuracy of the altaz function. I have been attempting to add altitude and azimuth columns to the “Messier” spreadsheet but in comparing the results to what I know are correct calculations, I am coming up with significant discrepancies.
LikeLike
I’ve checked the function and can’t find any problems, however there are a few gotchas, that have caught a few people out, I’ve listed below hopefully it is one of these and I can claim user error 🙂 and solve your problem.
1. format of parameters for the function is altaz(days after 1/1/2000, Dec, RA, Latitude, Longitude, Index) Note Dec, RA not RA,Dec
2. RA is in degrees not hours – this is true for all astroexcel functions – multiple hours by 15 to get degrees
3. Atmospheric refraction is not calculated use the refraction function if you want to include this.
4. If comparing with other programs check the RA and Dec they are using as they may be using the current epoch for the RA and Dec of an object and this will be different to the publish positions which will state an epoch usually 2000.0
5. If comparing with other programs check date and time, AltAZ uses UT, other programs may us local time (i.e. include time zone and daylight saving)
6. If comparing with other programs check you are using the same location
LikeLike
i discovered the problem. It’s not with the ALTAZ function at all. The problem is that the RA degrees shown on the “Messier” tab are not correct. You must have used the wrong formula to convert. Based on the numbers you have, you must have used (Min/60)+(Hrs*15).
The correct formula is ((Min/60)+Hrs)*15.
Additional columns I have since added to covert the RA/DEC on the Messier page now produce correct results.
LikeLike
Thanks for letting me know! There is now a new version with the correct values
LikeLike
I keep getting data may be lost error when I open d/load.
LikeLike
sorry I don’t know why that would be, i’ve downloaded it and it works fine for me. I have also updated a new version so you could try that.
LikeLike
This is a mammoth effort! It’s incredible since I did not come across this when doing my own programming with ASCOM and AAplus! This is a really great work.
LikeLike
Are you still supporting this software in 2017?
LikeLike
No not really it is more ‘copy left’ than supported – I do occasionally tinker but am very busy at work…
LikeLike
Can anyone assist? When changing longitude in the year planner, excel freezes. Is there an undocumented bug? I am using MSOffice2013.
LikeLike
Harry,
It is saved as a Excel ’97-2003 document so shouldn’t cause problems.
have you enabled macros – the whole spreadsheet is about 200 visual basic functions and the spreadsheet can’t run without them.
I started developing this a long time ago and probably passed through Office 2013 at some point.
Simon.
LikeLike
Date Moon Rise Moon set
05/04/2018 22:01:52 7:48:17
06/04/2018 22:59:14 8:28:11
07/04/2018 +23:53:14+ 9:12:50 <======= not correct
08/04/2018 23:53:12 10:02:15
09/04/2018 0:41:55 10:57:03
10/04/2018 1:25:17 11:54:30
LikeLike
Hello,
Thanks for the great work done on this excel workbook.
It has really helped me a lot in understanding some things…but there’s one thing I’m not getting in the functions, and that is how to predict lunar eclipses.
Please if there is a way to help me modify the EclipseSearch() and SolareclipseDetail() to predict both lunar and solar I would gladly appreciate. Or any other means to get it done I Will take.
Thank you
LikeLike
Hello
Please, can any help me modify some functions like the EclipseSearch() and SolareclipseDetail() to predict or work for both lunar and solar eclipse. Any help, I would gladly appreciate.
Thank you
LikeLike
feel free to have a dig around the functions in visual basic – I’m not supporting this software and unfortunately don’t have the time to provide detailed help (its taken me 3 years to reply to this! – sorry
LikeLike
Hi Simon,
your ability with astronomy is amazing to me. I work in the financial industry and I’m doing research on how the planet movement affects the price of stocks and not only. But now is my goal.
I’m looking for person like you that like the idea to work together on the topic. Could you be interested in it ?
In the meantime i’m looking for a sheet in xls with planet position in degree, do you know where I can find it ?
I hope that my proposal will intrigue you to work on it.
Kind regards, Ciro
LikeLike
Hi Ciro… still interested in Gann Financial/Astrology method? I’m exploring that in Excel… please contact me.
LikeLike
Simon,
Superb piece of work.
I’m a budding astrologer and this work of yours shortens my time to learn celestial bodies.
Thanks,
Sri
LikeLike
ops!!!!!! 08/04/2018 is not correct (Latitude 45.75 Longitude 11.,75)
LikeLike
Hey.. Can you make a transit excel sheet for me..? Transit of planets…
LikeLike
Do you mean transit across the meridian? Or are you after a transit of Mercury/ venus across the Sun?
LikeLike
I want you to make a position of planets in differnt houses and zodiacs with the help of Swiss ephemeris..
LikeLike
Mio lavoro e’ ora un programma AstroCalcolo in Excel .
https://www.astronomia.com/forum/showthread.php?5450-Foglio-excel-per-Calcolo-Effemeridi-e-altri-dati&p=318572&viewfull=1#post318572
LikeLike
Is that Italian? I’m an ignorant Brit so only speak English – sorry – lovely country Italy, lovely people, lovely food, great architecture, but I haven’t a clue what you are saying! 🙂
LikeLike
Sorry, this sounds like astrology, my interest is in astronomy, plus there are a lot of problems converting science to belief systems, for instance, there are 13 constellations in the zodiac, but only 12 recognised by astrology.
LikeLiked by 1 person
It’s not that specially vedic astrology we’re knowing about these constilation before astronomy subject emerged. But yes you can make a transit chart. That will help using ephemaries. That will be a great help
LikeLike
Hi, This file is amazing, would like to thank you for publishing such an informative data. I am learning astrology and need to know the degree of all the planets at a particular date time and Lat long. I am getting the rising time of the planets but not able to get the degree at some particular time. would be thankful if you could guide me for the same.
LikeLike
I’m not sure what you mean by ‘degree’
LikeLike